“The time for our leadership is now!”
Mr. Obama, president of United States, proclaimed in a speech given before the British Parliament on 5/25/2011, asserting the relevance of the British-American alliance in a world of rising powers and new threats. He rejected the argument that emerging titans like China, India and Brazil “represent the future and the time for our leadership has passed.” The United States and Britain, he said, “remain the greatest catalysts for global action.” The New York Times 25/5/11.
Who are the catalysts for Global Action?
This article, published every July for the third consecutive year now at the Metro Portal, www.metro.org.br, has the objective to analyze the performance of key countries around the world in Electric Power Generation. This being an analysis of annual data, the title remains: “Emerging Countries, Stagnant Countries”. Part One was published in 2009 with commentary available in Portuguese, in 2010 with commentaries also in Spanish, and now a Part Three with data from up to 2010 is being publishing in July of 2011, with commentaries in English as well.
The numbers and graphs speak for themselves, however, we wish to state our belief that the Electric Power Generation is an excellent indicator of the economic vitality of a country or region, and that the economic importance of a country can be well reflected in the statistics of Electric Power Generation.
Every year, British Petroleum’s magazine, Statistical Review of World Energy, publishes in June the statistical results calculated from the previous year on virtually all forms of energy produced and consumed worldwide. It is without a doubt the leading World Energy Atlas.
Unlike what occurred in 2009 when the total electricity generated in the world fell 0.9% (243 terawatt-hours, TWh) in relation to 2008 which was the first decline since 1982, in 2010 there was a significant recovery, with a growth of 5.9%, the fastest growth since 1990 when this pattern began to followed by SRWE.
While in 2009, the Metro Portal highlighted the 21 top ranking countries and in 2010 expanded the analysis to the 64 largest, now in 2011, the data for the 68 largest are being presented.
Some background information:
1) The comparisons are done in Blocks, Regions and Countries. What are the blocks? The countries named First World are grouped in the traditional Organization for Economic Cooperation and Development, or OECD block, which covers the United States, Canada, throughout Western Europe, Israel, Japan, Australia and New Zealand. The block called “Others Emerging” form a counterpart to the OECD, and includes the other emerging countries. The countries that make up the former Soviet Union are analyzed in another block. The European Union is also analyzed as a block, although many of its members are part of the OECD.
2) The six regions are the six continents: North America, South and Central America, Europe-Eurasia, the Middle East, Africa, and last Asia Pacific which also covers Oceania.
3) Countries included in 2010 only: Vietnam, Israel, Trinidad Tobago e China-Hong Kong.
4) Country excluded in 2010: Iceland.
As in the previous article, we used a biennium back to 1990 to facilitate the drafting and reading of graphs. Only the year of 2010 was isolated in order to highlight the latest effects. All data used is relative, i.e., the percentage of each block, region or country in relation to the world total. Countries with increasing growth are expanding their relative global shares, as countries with a decreasing growth are reducing their relative global shares.
Leaving each reader to interpret the graphs, we can announce some general evidence:
1) Countries with strongly increasing shares:
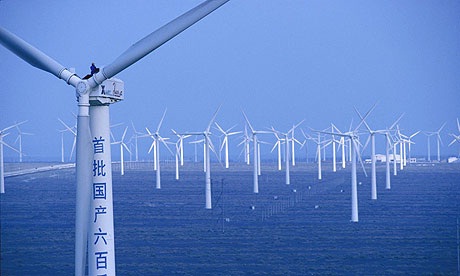
a) the Asia Pacific Region in the geographical area of influence of China,
b) the Middle East, especially by the positive effect of oil prices.
2) The moderate but sustainable growth of South and Central America and Africa.
3) The relative decrease of North America and Europe-Eurasia.
4) A strong decline of Eastern European countries and the former Soviet Union, mainly in the 90s, and in the 2000s there was a slowing, but continued fall.
5) Most recent data indicates that China surpassed the United States in Electric Power Generation this last May, as was foreseen. It is also visible in the graphs that India will soon surpass Japan and Russia. And finally, that Brazil and South Korea should soon reach the declining group that includes Germany, Canada and France.
Charts
Electricity Generation (%) – World Total = 100%
Origins: British Petroleum – Statistical Review of World Energy – June/2011
Chart 1- Blocks

Chart 2 – Regions – Group 1

Chart 3 – Regions – Group 2

Chart 4 – Countries – Group 1

Chart 5 – Countries – Group 2

Chart 6 – Countries– Group 3

Chart 7 – Countries – Group 4

Chart 8 – Countries – Group 5

Chart 9 – Countries – Group 6

Chart 10 – Countries – Group 7

Chart 11 – Countries – Group 8

Chart 12 – Countries – Group 9


Emerging Countries, Stagnant Countries – Part 4 – China Leads in Electric Energy
Países Emergentes e Países Estagnados – parte 2Países Emergentes y Países Estancados – parte 2
Colômbia: ONU indica que Exército age por recompensasColombia: ONU indica que el ejército actúa por recompensas
Related Articles