The evolution of per capita solid waste generation in developed and emerging countries
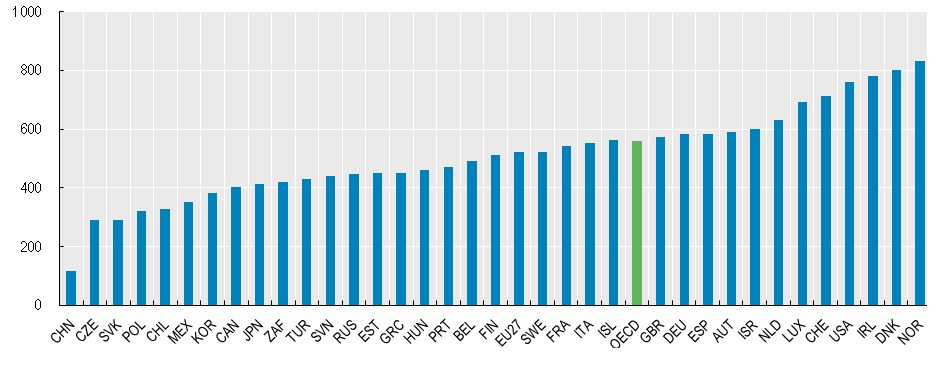
The OECD, Organization for Economic Co-operation and Development, consists of thirty-four member countries and was created from The Marshall Plan, the U.S. initiative in 1948 to rebuild Europe and Japan after the Second World War. Among them are the richest countries in the world. The per capita generation of solid waste in these countries and emerging South Africa, China and Russia will be examined here, as shown in Figure 3.
Figure 3 – Per capita generation of municipal solid waste in kg/person/year.
Source: OECD (2009).
Per capita generation of solid waste varies from 115 kg/person/year in China to 830 kg/person/year in Norway. Japan, one of the richest countries in the world, stands out for having reached 400 kg/person/year, far below the average of the countries surveyed by OECD calculated at 560 kg/person/year. The cost for the disposal of solid waste in Japan is ten times higher than what is spent on collection (70% is incinerated), due to the lack of physical space above all reasons, while developing countries spend up to 80% of their urban sanitation budget on waste collection (World Bank, 1999). Figure 4 illustrates the GDP growth and population of the countries surveyed by OECD in relation to solid waste generation.
Notice how on the analysis of Figure 4, from 2000 on there is a disassociation between economic growth and waste generation in the average of the thirty-seven countries studied. The data in Table 5 shows increasing amounts of solid waste per capita generated by these countries, far exceeding the expectations and estimates for 2030 of 694 kg/person/year.
Figure 4 – Comparison of the growth of the Gross Domestic Product, population, total per capita generation and solid waste collected by the OECD (1980-2030).

Table 5 – Index of population growth, the Gross Domestic Product and municipal waste in countries studied by OECD (1980-2030).
| 1980 | 1985 | 1990 | 1995 | 2000 | 2005 | 2010 | 2015 | 2020 | 2025 | 2030 | |
| PIB OECD | 100 | 113 | 129 | 146 | 163 | 193 | 219 | 249 | 277 | 306 | 337 |
| Population OECD | 100 | 104 | 108 | 112 | 116 | 121 | 124 | 128 | 130 | 132 | 134 |
| Total generated waste | 100 | 112 | 126 | 142 | 158 | 165 | 178 | 191 | 203 | 215 | 228 |
| Per capita generation (kg/person/year) | 408 | 442 | 478 | 517 | 557 | 559 | 584 | 611 | 635 | 664 | 694 |
GDP: Gross Domestic Product; OECD: Organization for Economic Cooperation and Development. Source: OECD (2010).
A significant effort has been made in Europe to reduce or at least stabilize the generation of solid waste per capita since 2000 where directives on the policies of production and consumption have been published. However, their goals are far from being achieved, according to the 5th Environment Action Programme (EAP) adopted by the European Parliament in 1992. One purpose of this program was to reduce and stabilize the per capita generation of municipal solid waste until 2000 to the average values of 1985 (5th EAP, 1993). The First Report (UK PARLIAMENT, 2009) Select Committee on Environmental Audit recognizes that the goal of reducing solid waste stipulated for EU countries in the Treaty of Amsterdam is far from being achieved, although there has been some modest progress regarding environmental legislation. The goals for the 6th EAP of July 2002 and the new European Directive (2008/98/EC) aim break the relationship between economic growth and the impacts associated with solid waste generation. Per capita solid waste generation in the new Member States (EU-12) holds an average considerably lower than those of Western Europe which has remained apparently stable since the mid-1990s, despite a strong economic and consumption development with a GDP growth of 16%, pointing to a mismatch between the two indicators. According to studies by the European Environmental Agency (EEA), the reason for this may be the entry of new member states, due to changes in methodology or the introduction of weighing equipment in some of these countries.
In the United States, the Environmental Protection Agency (EPA) released in 2010 the growth of per capita generation of solid waste from 1960 to 2006 and the reduction between 2007 and 2010, from 231 to 227 million tons, as shown in Figure 5 with a small reduction in the per capita generation of 2.10 to 2.01 kg/person/day. This period coincides with the global economic crisis, of which the epicenter is the U.S. itself, demonstrating once again the correlation between economic factors and per capita generation of solid waste.
Figure 5 – Per capita generation and municipal solid waste generation in the United States (1960-2009)

Source: EPA (2010)
For the effort of reducing waste generation in developed countries, economic instruments are included in the legislations thereof. Toll collection systems for landfill disposal and generation of solid waste, product taxes, deposit-return systems and credit for recycling are directed to industry, commerce, municipalities and the general public as contained in the information on Table 6 (Azevedo, 2004).
Table 6 – Economic instruments for the reduction of solid waste generation in countries considered developed.
| Types | Belgium | Canada | United States | Germany | Australia | Turkey | Spain | Denmark | Austria | Korea | Finland | France | Holland | Ireland | Italy | Sweden | United Kingdom | Switzerland |
| Charge por disposal in landfill |
X |
x |
x |
x |
X |
x |
x |
x |
x |
x |
X |
X |
x |
x |
x |
|||
| Charge for residential waste generation |
X |
x |
x |
x |
x |
x |
X |
X |
X |
|||||||||
| Product Tax |
X |
x |
x |
x |
X |
x |
x |
x |
||||||||||
| Deposit – Return system |
X |
x |
x |
X |
x |
x |
X |
x |
x |
|||||||||
| Credit for recycling |
x |
x |
Source: Azevedo (2004).
Experiments cited by Azevedo (2004) record U.S. efforts to reduce organic waste with the incentive of backyard composts for garden pruning. Government regulations in Belgium require municipalities to charge fines if the amount of waste collected is greater than allowed, including voluntary community services for the implementation of collective composting systems in free areas of these municipalities. In Italy there is a growing expansion of selective collection. In Toronto, Canada, the distribution of “yellow bags” for collecting recyclable wastes has reduced the city’s waste generation. Denmark has made rubble recycling a reality (Novaes, 2001). Policies to encourage sustainable consumption have obtained positive results in Germany, Spain and Finland (BIANCHI; CIAFANI, 2009).


4th National Environmental Conference – Part 2 – Revitalizing solid waste

The 4th National Environmental Conference
Evolutional factors of per capita solid waste generation in Brazil


Recycling in Brazil: imagine your son in this situation
Related Articles


Comments